
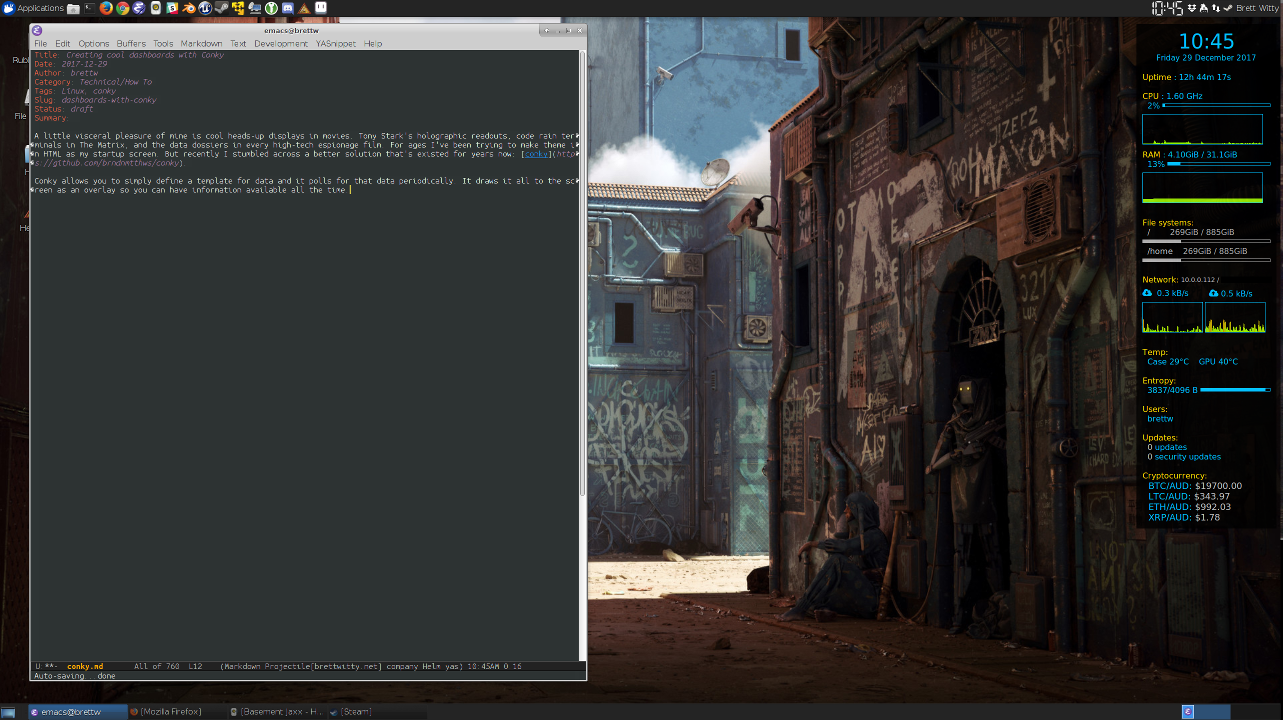
A little visceral pleasure of mine is cool heads-up displays in movies. Tony Stark’s holographic readouts, code rain terminals in The Matrix, and the data dossiers in every high-tech espionage film. For ages I’ve been trying to make theme in HTML as my startup screen. But recently I stumbled across a better solution that’s existed for years now: conky.
Conky allows you to simply define a template for data and it polls for that data periodically. It draws it all to the screen as an overlay so you can have information available all the time. Here’s what mine looks like (over on the left hand side of the screen):
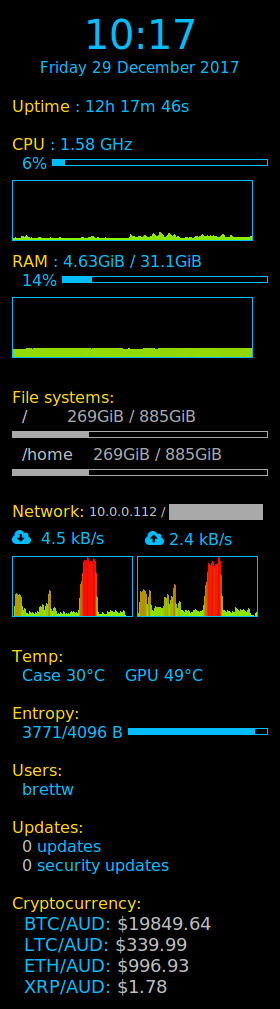
I also have a close-up version.
It’s not as fancy as some of the conky setups out there, but I’ll walk you through how I made it.
Installing Conky
To install conky on Ubuntu/Debian:
sudo apt-get install conky
By default your settings are in ~/.config/conky/conky.conf. This is a text file that we’ll edit.
While building the display, have a terminal open and run conky. This will run it in foreground mode and you can see errors and when conky has noticed your configuration has changed and is reloading.
Once you have it all set up, you can run it with conky -d as a background daemon. I added it to my XFCE startup script(Settings -> Session and Startup -> Application Autostart -> Add…)
Be warned - there is a lot of documentation for conky, but that doesn’t mean it’s well-organized or easy to browse. And there was a previous format for configuration, which you may run into if you are using someone’s ancient profile.
Conky Configuration
Our main file to edit is ~/.config/conky/conky.conf. This is now a Lua file with two main sections: conky.config and conky.text.
conky.config is a dictionary (in Python parlance, associative arrays elsewhere). You have keys and their values:
conky.config = {
         alignment = 'top_right',
         double_buffer = true,
         -- ...
         };
If you don’t know Lua, -- blah is a comment, which is handy to turn on/off settings. Don’t forget the semi-colon if you’ve been doing too much Python.
conky.text is a template where you specify commands in order (with spacing) and that defines the dashboard. Here’s a starter one:
conky.text = [[
Hello

World!
]];

It’s an inauspicious start, but it’s a start!
Configuration settings
Let’s build up my conky.config to see how it works.
conky.config = {

alignment='top_right',
gap_x=1940

};
alignment places the dashboard on your display. Note that if you have multiple monitors like I do, it treats the entire display as one big canvas. I wanted my dashboard in the middle of my two monitors. To achieve this you have to set an x-offset, which is what gap_x does. So these two lines put everything on the top right of the display, but shifted the width of my other monitor (1920 pixels, plus a little bit). Make sure you set gap_x appropriate to your setup (or omit it entirely if you just have one monitor or it’s where you want it!)
We want the dashboard to be overlaid on the desktop and non-interactive. We achieve that with:
conky.config = {

alignment='top_right',
gap_x=1940,

own_window=true,              -- Make its own window?
own_window_argb_visual= true, -- Allows transparency
own_window_type='desktop',    -- No borders, always visible on the desktop,
                              -- on all workspaces, and doesn't appear in the taskbar
};
Here’s how it looks:
Not amazing, but we’ll get there. Let’s add transparency to the background and fix the width.
conky.config = {

alignment='top_right',
gap_x=1940,

own_window=true,              -- Make its own window?
own_window_argb_visual= true, -- Allows transparency
own_window_type='desktop',    -- No borders, always visible on the desktop,
                              -- on all workspaces, and doesn't appear in the taskbar
own_window_argb_value = 200,  -- Alpha is between 0 (transparent) and 255 (opaque)
own_window_colour='000000',   -- Set a black background for contrast

maximum_width=256,            -- Min and max width of 256 pixels, which fixes the width
minimum_width=256,            -- This means the display won't wriggle around if things
                              -- are too big
};

Nice. Now let’s fix the font (from here on, we’ll omit the config we’ve already established):
conky.config = {

-- [Previous settings]

font='Droid Sans Mono:size=11', -- Set a nice mono font
use_xft=true,                   -- This allows us to use arbitrary fonts
                                -- instead of just the X11 ones.

};
Finally add a little bit of padding and default colouring:
conky.config = {

-- [Previous settings]

border_inner_margin=10, -- Add a 10 pixel inner padding.
default_color='00bfff', -- Make the default colour a cyber blue

};

When you specify colours in Conky, they are hex ARGB values without the customary #.
This will finish our default configuration. Feel free to mess with the defaults to make something that looks right for you.
Getting data onto the dashboard
This is all great if you just want “Hello World!” but we want cool data! Let’s dive into conky.text!
The template is a whitespace-sensitive bit of text with commands that look like ${time %H:%M}. I’ll demonstrate how to achieve parts of my setup so you can mix and match for yourself.
Clock
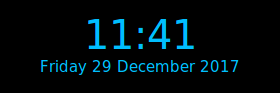
This looks complicated in code, but it introduces you to some basic ideas:
conky.text = [[
${alignc}${font Droid Sans Mono:pixelsize=40}${time %H:%M}${font}
${voffset 5}${alignc}${font Droid Sans Mono:pixelsize=15}${time %A %d %B %Y}${font}
]]
First up ${alignc} means that this line is centered. You’ll notice it on the next line as well. Once you have a linebreak, it’ll revert to left-aligned. ${alignr} gives you right-aligned text if you want that.
${font Droid Sans Mono:pixelsize=40} sets the font and some settings, namely that it should be 40 pixels high. This will be the font until you turn it off with ${font}, where it will revert to the default font we set in conky.config.
So far we’ve set some settings but there’s no text. With ${time %H:%M} it will replace this with the current time, using the time format %H:%M. This is the standard time formatting template, but you can look at the man page for date for a quick reminder.
We’ve added the time and set the font for that little bit. This might be a good point to let you know that conky isn’t real time. It updates every 3 seconds by default, so you don’t waste CPU and power. You can set the update interval in conky.config with update_interval or update_interval_on_battery if you want different behaviour on your laptop.
The second line of the settings are very similar to the first. We’ve made the font smaller to fit it on the screen and used the date template to get “Friday 29 December 2017”. You’ll notice I added ${voffset 5}. This says “instead of drawing this line where it is, offset it vertically by 5 pixels”. It gives a little comfortable space between the time and the date. You can use negative offsets to overlay things or do cunning nested lines.
Uptime

conky.text = [[
${color gold}Uptime${color} : $uptime
]]
This is fairly simple but introduces you to colouring text. Just like choosing a font you specify a ${color gold} first and then close it with ${color}. You can use ARGB colours or X11 colour names (/usr/share/X11/rgb.txt for the full list).
I’ve chosen a colour scheme with hacker blue, gold and grey for default, highlight and lowlight (respectively).
$uptime is another function that replaces itself with the current uptime. You’ll notice there’s no braces. This is because it doesn’t take any parameters, but you can add the braces in if you want a consistent style.
System resources
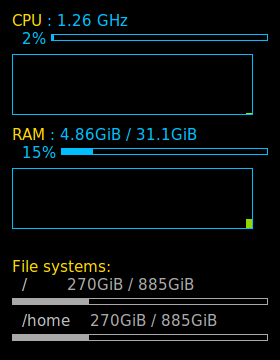
We now get into the meat of the dashboard: the CPU, Memory and File system data.
conky.text = [[
${color gold}CPU${color} : $freq_g GHz
  ${cpu}% ${cpubar}
${cpugraph 60,255 7fff00 ff0000 -t}
${color gold}RAM${color} : ${mem} / ${memmax}
  ${memperc}% $membar
${memgraph 60,255 7fff00 ff0000 -t}

${color gold}File systems:${color}
  ${color grey}/        ${color darkgrey}${fs_used /} / ${fs_size /}
${fs_bar /}
  ${color grey}/home    ${color darkgrey}${fs_used /home} / ${fs_size /home}
${fs_bar /home}
]]
These follow very similar formats. We colour the heading in gold, add a specific measurement, then underneath a percentage usage with a bar, then a graph over time.
For the CPU:
${freq_g}gives the effective GHz frequency of your CPU.${cpu}gives the current percentage of CPU used. Note you have to put%after it yourself. You can use${cpu cpuX}withXa 1-up number for specific CPU core.cpu0is the total usage and the default.${cpubar}gives the same information as${cpu}but in horizontal bar form. You can limit the CPU like above. You can also specify the height and width:${cpubar 10,100}for a 10x100 bar.{cpugraph 60,255 7fff00 ff0000 -t}graphs the CPU usage over time in a 60x255 pixel box. It also colours the line between green (#7fff00) and red (#ff0000), making a smooth gradient (-t) depending on the amplitude.
We made the box 255 pixels to fit into the 256 pixel width.
The same thing applies for the memory and file-system. Note with the file-system you have to give the root path (/ or /home).
I lowlighted the filesystems to reduce their prominence which makes the entire dashboard easier to read.
Also notice that the lines containing bars are indented. This gives a little visual guide as well.
Networking
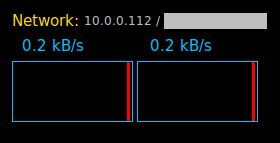
This one is slightly more complicated. We want the internal and external IP addresses, as well as upload/download speeds.
conky.text = [[
${color gold}Network:${color} ${voffset -1}${font :size=9}${color grey}${addrs enp0s31f6} / ${execpi 300 /home/brettw/.config/conky/scripts/get_ip.sh}${color}${font}
${voffset 5}${template1}  ${downspeedf enp0s31f6} kB/s ${goto 145}${template0} ${upspeedf enp0s31f6} kB/s
${downspeedgraph enp0s31f6 60,120 7fff00 ff0000 -t} ${upspeedgraph enp0s31f6 60,120 7fff00 ff0000 -t}
]]
We’re now familiar with colour, font sizes and offsets, so I’ll skip over that.
${addrs enp0s31f6} gets the IP address of the adaptor named enp0s31f6 which comes from the unsexy Predictable Network Interface Names standard from systemd. Your Linux system may work differently, so your interface can be found with:
ifconfig -s | cut -f1 -d" " | tail -n+2
The IP address from ${addr} is your local one, so you might not get anything enlightening from it.
The next bit of the template is ${execpi 300 /home/brettw/.config/conky/scripts/get_ip.sh}. This executes a command, every 300 seconds (5 minutes) and will parse the results, replacing anything template-y with what it should be. I put the script in a subdirectory of the main conky configuration, so everything stays together.
My script is simply:
#!/bin/bash
wget http://checkip.dyndns.org -q -O - | grep -Eo '\<[[:digit:]]{1,3}(\.[[:digit:]]{1,3}){3}\>'
It queries DynDNS for your external IP and greps it out for you from the response.
We run these scripts infrequently because the information doesn’t change often, and to prevent you from being flagged as abusing the service.
The commands ${downspeedf adaptor} and ${upspeedf adaptor} give you the downspeed and upspeed rates in KiB/second with one decimal place. You can replace with ${downspeed adaptor} and ${upspeed adaptor} which will convert the speeds to the right IEC units and give you that unit (X MiB instead of 1024*X). I tend to use the former since there are fewer distracting changes as it updates
${goto 145} moves over 145 pixels to the right. I do this to make the rates mostly line up with the graphs.
${downspeedgraph} and ${upspeedgraph} graph the speed as you’d expect, and the extra parameters are like the ones in ${cpugraph}.
One last thing, ${template0} and ${template1}. Turns out you can add your own templates to the config to make certain additions easier to see. In conky.config I had the lines:
conky.config = {
-- [Previous settings]
template0="${font Font Awesome}${font}",
template1="${font Font Awesome}${font}"
};
I had installed the Font Awesome desktop font, and used Unicode to put in the cool “cloud with up/down symbol”. You can use any font with Conky if you have use_xft=true set in your config.
Using icons just makes the graph more interesting, and easy to see at a glance which data is for upload/download. This is one way you can get symbols into Conky.
Temperatures

If you want to display temperatures, there are a wealth of potential probes. The ones that worked for me were the ACPI temperature and the GPU one.
conky.text = [[
${color gold}Temp:${color}
  Case ${acpitemp}°C    GPU ${exec nvidia-settings -tq '[gpu:0]/GPUCoreTemp'}°C
]]
Notice I’ve used Unicode to get the degree sign in. ${acpitemp} is a standard Conky command.
For the GPU I had to query the device using Nvidia’s software. Their poorly-documented query interface can extract all sorts of information about the GPU. My main GPU’s temperature can be queried with the command above. If you have multiple GPUs you can query each individually. Notice here I’ve used ${exec}. This runs a command, at the same update interval as the window, and doesn’t parse the output. I could have a script wrapper around this command and used that to output (say) colour changes, but I don’t do that at the moment.
Miscellaneous info
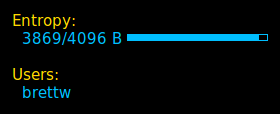
conky.text = [[
${color gold}Entropy:${color}
  ${entropy_avail}/${entropy_poolsize} B ${entropy_bar}

${color gold}Users:${color}
  ${user_names}
]]
I periodically query the entropy pool to see how it’s going. You can notice changes when things are generating random numbers (say for crypto). ${entropy_avail}, ${entropy_poolsize} and ${entropy_bar} give you the current entropy, the poolsize and draw the bar graph for entropy, as expected.
I also plot out the currently-logged in users. This should be just myself, but it may fluctuate with different services on different usernames, or if someone nefarious is snooping about. ${user_names} lists the users. ${user_count} gives just a count, and ${user_times} can tell you how long users have been logged in for.
Track updates
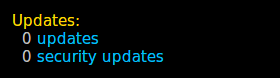
conky.text = [[
${color gold}Updates:${color}
${execpi 1800 /home/brettw/.config/conky/scripts/apt-updates.py}
]]
I occasionally like to know whether Aptitude has any new updates, especially any security updates. This polls the library infrequently (since it may need to go to many providers, and updates aren’t that frequent). As before, this runs a script.
#!/usr/bin/python3

import subprocess

tmp = subprocess.getoutput("/usr/lib/update-notifier/apt-check")

# Results are like "10;1" so we split them
updates, security = [ int(s) for s in tmp.split(';')]

# Change colours for warnings
if updates > 100:
    ucolor = 'red'
elif updates > 0:
    ucolor = 'green'
else:
    ucolor = 'grey'

if security > 0:
    scolor = 'red'
else:
    scolor = 'grey'

ucolor = '${color ' + ucolor +'}'
scolor = '${color ' + scolor +'}'
endcolor = '${color}'

print('  {0}{1}{2} updates'.format(ucolor, updates, endcolor))
print('  {0}{1}{2} security updates'.format(scolor, security, endcolor))
Most of the code in this script is figuring out if there are a lot of updates or not. For normal applications, 100 is a lot. For security, any number is a lot. This outputs text with colour tags so that ${execpi} will pick it up and interpret it.
JSON API queries
The last component I have is a thing that queries a cryptocurrency market for the latest prices. You can generalize that a little to any JSON API you wanted to query. If you needed inspiration, here’s a gigantic list of public APIs.
#!/usr/bin/python3

import requests
import json

def getCurrency(a,b):
    URL = 'https://api.btcmarkets.net/market/{}/{}/tick'.format(a,b)
    try:
        r = requests.get(URL)
        data = r.json()
        buy = float(data['bestAsk'])
        sell = data['bestBid']
        print('  {}/{}: ${{color grey}}$${:0.2f}${{color}}'.format(a,b,buy))
    except:
        pass

if __name__ == '__main__':
    getCurrency('BTC','AUD')
    getCurrency('LTC','AUD')
    getCurrency('ETH','AUD')
    getCurrency('XRP','AUD')
This gets the last values off BTC Markets and displays them. You’ll notice the very minimal error-handling - basically if anything goes wrong, it just bails. This is an informational service, so anything more complicated than failing silently is probably over-engineering it.
You’ll need to check the API and the requirements for any service you use.
This script is wrapped in a ${execpi} with a long enough interval to not annoy the API owner. Conky will also parse the formatting we output, so I can colour the results how I like. If you kept values you could colour a currency by whether it is going up or down.
If you want more of a tutorial on how to deal with APIs in Python3, check out this one from Digital Ocean.
Stepping forward
If you want fancier UI elements like circular gauges, you may have to dive into Lua programming. Conky supports Lua, but I hope I’ve demonstrated that you can occasionally drop the task to a Python script and have Conky work it all out.
Check out the Conky wiki on Github, especially the User Configs if you want inspiration or code to steal. Just watch out for the old-style configs!